Views on Climate Change
IPCC View — Alternative View — Biblical View — Conclusions
“The important thing is not to stop questioning” [Albert Einstein]
We all love the planet and want to preserve it. But only a relative few love the truth. What is really going on? Here’s a few views on climate change to get us started:
FACT 1: Climate change is real. The mean global temperature has increased about 0.8° Celsius (1.4° Fahrenheit) since 1880, link. Some scientists claim this is causing the weather to become more erratic, link, but others refute such claims, link.
FACT 2: Atmospheric CO2 has increased dramatically in recent years. Over the past 800,000 years the CO2 level has always been below 300 ppm, but today it stands at over 400 ppm and is rising rapidly, link. The rise is attributed to the rapid rise in the burning of fossil fuels from around 1950, link.
FACT 3: Curiously, the present inter-glacial period (with CO2 c400 ppm) is about 2°C colder than the previous inter-glacial period (when CO2 was less than 300 ppm), link. Such observations throw doubt upon the popular greenhouse theory, link.
FACT 4: About 96% of CO2 emissions to the atmosphere are from natural sources and only 4% is man-made (anthropogenic), link. Put another way, man’s CO2 contribution to the greenhouse effect (GHE) is only about 0.14%, whilst water vapour contributes about 95%, link.
FACT 5: Some scientists claim that there is no correlation between atmospheric CO2 rise and ocean heat content increase over the past 7,000 years, Gosselin. And the atmosphere cannot warm until the oceans do.
FACT 6: Some scientists argue that temperature change is actually largely due to fluctuations in solar irradiance. There is a strong correlation between global mean sea surface temperature (SST) and sunspot number, link. Solar irradiance changes can change cloud formation and hence change temperature.
FACT 7: Some scientists claim the IPCC models used for temperature prediction are inaccurate, Nakamura. Model predictions have been significantly higher than observations, link. Even CO2-warming theory itself is seriously questioned – it is claimed that the physics is simply wrong, link, link.
FACT 8: Some scientists claim to have evidence of temperature data manipulation, changing raw temperature measurements to “final” data for use in models, see Goddard.
FACT 9: Some scientists claim the CO2-temperature relationship is logarithmic, not linear. As we add more CO2 to the atmosphere the warming effect of adding the same amount each time rapidly becomes insignificant, link.
FACT 10: NASA GISS data over the past 30 years show no unusual changes happening (no unusual temperature trends) for the seven warmest stations located at the West Antarctic peninsula, Gosselin, 2020.
A final point; it is interesting to note that the Bible describes relatively short but severe weather events (not long-term climate change) in both the past and the future. We could regard this as a third viewpoint on what is going on.
The IPCC View
Of the different views on climate change, almost without exception the media and politicians accept the IPCC view and its warnings. The IPCC claim that a relentless rise in atmospheric CO2 is the major factor in driving climate change. So many countries are now embarking upon a “zero carbon” programme.
What is the IPCC?
The Intergovernmental Panel on Climate Change or IPCC is a scientific intergovernmental body established by the UN and the World Meteorological Organization. It has nearly 200 member countries and it’s main activity is to provide regular reports of the state of knowledge on climate change based on the work of hundreds of leading scientists from all over the world. Thousands of other experts contribute to the reports by acting as reviewers, ensuring the reports reflect the full range of views in the scientific community. The IPCC’s fifth Assessment Report (AR5) of 2013 states:
There is consistent evidence from observations of a net energy uptake of the earth system due to an imbalance in the energy budget. It is virtually certain that this is caused by human activities, primarily by the increase in CO2 concentrations. Global average temperatures could be more than 2 degrees above average by 2100, and could reach 4.8 degrees
Popular Scientific Evidence of Climate Change
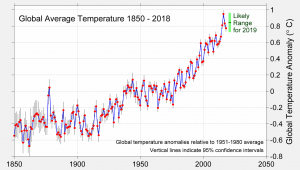
Fig.1: Global Average Temperature. BerkeleyEarth. CC BY 4.0. Enlarge
Fig.2: CO2 and Temperature correlation. NASA. Graphs: Robert Simmon. Enlarge
Fig.3: Change in Global Average Sea Level. Wikimedia. Enlarge

Fig.4: Sydney Sea Level Change. Climate4you. Enlarge
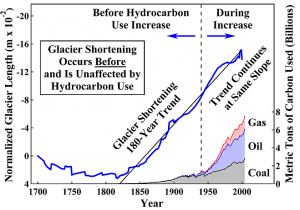
Fig.5: Glacier shortening. Robinson et al. Enlarge
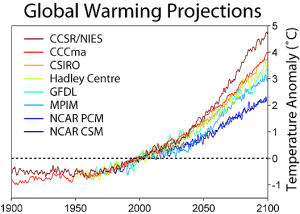
Fig.6: Model Projections. Global Warming Art by Robert A. Rohde, Wikimedia, GNU Free License. Enlarge
The following observations are frequently cited:
Global Temperature Rise: Figure 1 shows global temperature anomalies relative to the 1951-1980 mean. The graph combines both land and ocean data. Temperatures in 2018 were around 1°C above the average temperature of the late 19th century (the pre-industrial period). It is interesting to note that temperature was stable between 1940-1980 despite the fact that, by 1940, man was generating significant CO2, link.
CO2 and Temperature: Figure 2 shows levels of atmospheric CO2 taken from Antarctic ice-core data (air trapped in the ice is used to determine the CO2 levels of past climates). CO2 levels have corresponded closely with temperature over the past 800,000 years. Although not evident on this large-scale graph, it is important to note that CO2 is not the causal warming factor. The temperature changes were actually initiated by variations in Earth’s orbit and the increased global temperatures released CO2 into the atmosphere – similar to CO2 emitting from a fizzy drink! This in turn further warmed the Earth, link.
Sea Level Rise: Sea level rise occurs through the added water from melting ice sheets and glaciers. Land ice sheets in both Antarctica and Greenland have been losing mass since 2002. Sea level rise also occurs from increased ocean temperature. About 93% of the excess heat produced by greenhouse gases has been absorbed by the oceans. This results in an increase of ocean volume through thermal expansion.
Figure 3 shows mean global absolute sea level rise 1870-2008 based upon tidal gauges (satellite altimeter measurements can be pessimistic, link). Over this period sea level has risen about 9 inches or about 0.23m. To put this into context, sea level rise from the last ice age was about 120m, see graph. Whilst Fig.3 shows a steadily increasing global trend, regional trends vary (Fig.4) and absolute sea level has actually decreased in some places.
Curiously, Fig.3 shows that the rate of rise up to 1940 is about the same as the rate from 1940 onwards (1940 roughly marking the start of the serious use of fossil fuels, link). A constant rate of rise from mid-19th century to 2020 is also shown by NOAA tide gauge data. This data contradicts IPCC/UN claims of accelerated rise over recent decades.
Glacier Shortening: Figure 5 shows that the 19th century saw not only sea level rise, but also a steady decline in glacier lengths across the world. Curiously, like sea level rise, glacier shortening started some 100 years before the sharp rise mid-20th century in the use of fossil fuels, link.
Warming Projections: Figure 6 shows early warming projections from several different climate models. They indicated a 2-5°C rise by 2100 (a 5°C rise is equivalent to the change in mean temperature from the last ice age to today). The IPCC AR4, 2007 Report claimed:
World temperatures could rise by between 1.1 and 6.4°C during the 21st century”
The IPCC AR5, 2013 Report used improved models and concluded:
Global surface temperature change by 2100 is likely to exceed 1.5°C relative to 1850 to 1900 for all RCP scenarios except RCP2.6. It is likely to exceed 2°C for RCP6.0 and RCP8.5″ [ IPCC AR5, 2013 ]
AR5 graphs indicate a 1-3.5°C rise by 2100 relative to the 1986-2005 mean.
Measuring Anthropogenic CO2
For the present, let’s assume that the rise in atmospheric CO2 is the principal factor causing warming. There is an immediate problem – how is anthropogenic CO2 measured? As of 2018 it was claimed that, link:
There is no reliably accurate way to measure total (man-made) global emissions or how much CO2 is coming from individual nations … there is no sure way of knowing by how much global anthropogenic emissions are actually increasing.
If this is the case, how can the IPCC be so certain warming is largely due to man’s activities? If CO2 rise really is the cause of warming, then at least we should try to understand how anthropogenic CO2 is measured. One way is to look at historical records of human activities (e.g. fossil fuel emissions started in earnest around 1950) and estimate the anthropogenic CO2 after accounting for ocean and land absorption.
Carbon Isotopes: Another, more direct approach, is to use the carbon isotope ratio C13/C12, link, link. This can be used since plants (forests and hence fossil fuels) have a slightly lower C13/C12 ratio (about 2 percent) than that of the atmosphere. So as anthropogenic CO2 is released into the atmosphere, the C13/C12 ratio of the atmosphere decreases. The latter can be estimated as a time series by measuring the C13/C12 ratio of tree growth rings. If this ratio decreases in time, we conclude that anthropogenic CO2 is having an effect.
Cumulative Increase in Anthropogenic CO2: Some claim that both anthropogenic and natural emissions have been steadily increasing for decades. Around 1960 anthropogenic CO2 was around 4% of total CO2, rising to around 11% around 2010, link. An anthropogenic CO2 level of around 4% was also reported in 1997, link. The significant point here is that, although relatively small, the anthropogenic CO2 is cumulative:
If you have equilibrium without the human-generated CO2, you have no climate change (from this source). But if you add 2% per year (and humans add only, they don’t subtract) that makes 100% change in 50 years, link
A Scientific Consensus
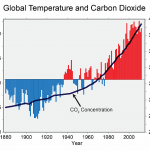
Figure 7 shows atmospheric CO2 concentrations and global average temperatures, measured over land and oceans, relative to the mean for 1901-2000 (data source: NOAA/NCDC). This graph sums up the IPCC case for CO2 warming. Their case is that, whilst natural land and ocean carbon remains roughly in balance (release ~ absorption, Fig.7.3 IPCC AR4 Report), this balance is disturbed by anthropogenic CO2, only about 40% of which can be absorbed. So there is a cumulative increase in net atmospheric CO2, link, link. That said, same claim the natural atmospheric CO2 is also increasing, link, suggesting the natural carbon balance model is simplistic.
Despite this controversy, in 2009 the following statement on climate change was issued by 18 Scientific Associations, link:
Observations throughout the world make it clear that climate change is occurring, and rigorous scientific research demonstrates that the greenhouse gases emitted by human activities are the primary driver.
This is endorsed by NASA, link, link:
Multiple studies published in peer-reviewed scientific journals show that 97 percent or more of actively publishing climate scientists agree: Climate-warming trends over the past century are extremely likely due to human activities. The amount of solar energy received by the Earth has followed the Sun’s natural 11-year cycle with no net increase since the 1950s. Over the same period, global temperature has risen markedly, so it is extremely unlikely that the sun has caused warming over the past half-century.
The caveat here is that many scientists who hold an alternative view meet opposition from University research funding policies and peer-reviewed publication.
The Financial Cost of Zero Carbon
In 2019 the UK became the first major economy in the world to pass laws to end its contribution to global warming by 2050, link. The UK has now embarked on an ambitious target of “Net Zero” carbon by 2050 i.e. any emissions would be balanced by schemes to offset an equivalent amount of carbon from the atmosphere, such as planting trees or using technology. The cost to the UK: Some £50 billion pa, or a total cost of over £1 trillion, link.
If achieved, how effective will this be? As of 2020 the UK contributed just 1% to the global anthropogenic CO2, link, link, or just 0.04% of the total atmospheric CO2. This seems rather small!
An Alternative Scientific View – Climate Change is Natural
Besides the IPCC view (anthropogenic CO2 drives climate change), there are other views on climate change. The IPCC view is rejected by leading research groups. For example, in November 2019 the Climate Intelligence Foundation (Clintel), a Dutch group with signatures from over 700 prominent scientists, stated to the European Parliament:
There is no climate emergency … climate models have many shortcomings … warming is largely due to natural causes. link, link
Increasingly, scientists are pointing to data which suggests that climate changes are largely a result of natural cycles of cold and warm phases which have been occurring for thousands of years. Put another way, these scientists have a problem with the IPCC deductions. Their main concerns are:
- the physics of IPCC modelling
- the poor modelling of periodic Atlantic and Pacific oscillations
- the assumption that solar irradiance changes now have minimal effect
- the neglect of ice core data showing CO2/temperature variations over hundreds of thousands of years
- the non-causal effect of CO2 on warming
- the neglect of the beneficial effect of CO2 on plant life
- the claimed adjustments of raw temperature data (to fit a political agenda?)
The overriding concern is the IPCC insistence that anthropogenic CO2 is the principal driver of climate change. Many insist it is not, and cannot be! The net effect is poor model predictions when compared to observed data, even to the point that later IPCC predictions have to be scaled back. Sadly, these concerns are rarely heard due to media and political bias and University research funding policies.
Fig.8: Surface Temperature Predictions and Observations. Enlarge
Issues with Climate Modelling
Figure 8 shows observed globally and annually averaged surface temperature (°C) since 1990 compared with the temperature projections from previous IPCC assessments e.g. AR4. Values are aligned to match the average observed value at 1990. Observed global annual temperature change, relative to 1961-1990, is shown as black squares. Note that the observed temperatures are very near or below the low end projections of IPCC AR4 (2007). Why?
It is claimed that computer models have been generated based on the unproven “Radiated Greenhouse Gas Emissions” theory which predicts catastrophic changes in the Earth’s climate leading to much future death and destruction. Here are some claims of poor modelling:
IPCC’s “Greenhouse Effect Global Warming” dogma rests on invalid presumptions and a rejectable non-realistic carbon cycle modelling which simply refutes reality … the IPCC model is neither supported by radioactive nor stable carbon isotope evidence, link
Climate models are useful tools for academic studies … but just become useless pieces of junk when they are used for climate forecasting, link
There is no physics, there are no equations in the models that determines the strength of the Greenhouse Effect (GHE). Parameters are just set to obtain the observed temperature, Gregory, 2009
The IPCC’s model assumptions that long-term natural net rate of accumulation is constant and anthropogenic emission rates are the only contributor to total long-term accumulation of atmospheric CO2, is false, link
Hundreds of computer models have been developed costing many millions of dollars to calculate “greenhouse” warming due to anthropogenic CO2 … but all of these are purely academic subjects for discussion and study. They have no measurable effect on Earth’s climate, link
(Currently) climate forecasting is simply not possible … the models grossly simplify the way the climate works. As well as ignoring the sun, they also drastically simplify large and small-scale ocean dynamics, link
The simulation of clouds in climate models remains challenging. There is very high confidence that uncertainties in cloud processes explain much of the spread in modelled climate sensitivity (IPCC AR5, 2013), link
Based on stability analysis, Coupled General Circulation Models (CGCMs) which have a dynamical core according to the primitive equations or shallow water model, without external controlling forces, cannot produce a reliable result after a long run simulation because of instability growth rate which exists in the model, lack of exact parametrization and micro-physics, unknown phenomena, etc., link
The reason why the CO2 atmosphere theory can never work is that the ocean-atmosphere interface controls the amount of CO2 in air. Just as when you warm a glass of fizzy drink more CO2 comes off and it absorbs more when it is cold. Putting more CO2 above the glass does NOT however warm it up! Ocean temperatures CONTROL atmospheric CO2 levels. Millions of years of data show that ocean temperature changes LEAD atmospheric CO2 changes, link
The basic assumption on which the entire theory that human activity is causing global warming or climate change is wrong … The (IPCC) computer models are the only place in the world where a CO2 increase precedes and causes a temperature change. link
Issues with Data
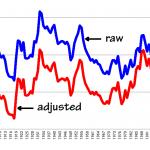
Fig.9: US monthly temperatures. Data: NOAA via Real-Climate. Enlarge
Some question the validity/integrity of the data used by climate models. For example, why does measured i.e. raw surface temperature data from US ground stations show virtually no temperature increase from 1895 to 2018, link? Figure 9 shows the average monthly thermometer measurements (blue) from all US Historical Climatology Network Stations (USHCN), with “final” i.e. adjusted temperature data in red. The latter shows a marked increase in temperature from 1970. So some claim that USHCN raw temperature data, as used by NOAA, has been “adjusted” from 1970, Goddard, 2015, link:
Virtually all of the USHCN warming since 1973 appears to be the result of adjustments NOAA has made to the data link
The total amount of tampering reached record levels in 2014, at almost 1.8 degrees F. They create the appearance of warming by cooling all years prior to 2003, and warming all years since that date. link
Issues with CO2
Causality: The IPCC claims that CO2 rise causes temperature rise i.e. CO2 is the causal factor. As just stated, this is not what is observed. A statistical analysis over 39 years of (satellite) data shows that CO2 has not caused temperature change, but rather that the rate of change in CO2 concentration has been influenced to a statistically significant degree by the temperature level, link.
This explains why ice core data shows CO2 change lagging temperature. Sometimes, atmospheric CO2 didn’t begin to rise until 400 to 1,000 years after the planet began to warm, link. Modern data shows changes in global atmospheric CO2 lagging 11–12 months behind changes in global sea surface temperature, link. It is argued that for CO2 rise to cause temperature rise would great a continuous positive feedback loop, evaporating the oceans long ago. Rather, an intricate feedback system regulates the Earth’s temperature, maintaining immunity from temperature increases and decreases due to such trace gases (like CO2), link.
Fig.10: CO2 and Ice Sheet Temperatures. Climate4you. Enlarge
Negative Correlation: Figure 10 shows the air temperature at the summit of the Greenland ice sheet, reconstructed by Alley (2000) from GISP2 ice core data. The temperatures tend to reflect global temperature changes over the past 6,000 years (up to 1855 AD) and show several warm periods (green), including the current one. Despite the warm periods, there is a clear cooling trend over the last 4000 years whilst CO2 (red graph) steady rises! It seems that CO2 is negatively correlated with Greenland temperatures over this time span (the complete opposite of the IPCC thesis).
Recent Correlation Measurements: Using the HadCRUT global temperature dataset (used by the IPCC) and ice core data, it was found that from 1850 to 2015 rapidly increasing CO2 concentrations only correlated with rapidly increasing global temperatures for one 25-year period (1977-2001). That is:
For 85% of the 165 year period there was little to no correlation between CO2 concentration changes and temperature changes, Gosselin, 2016
Similarly, a comparison of atmospheric CO2 concentrations from 1979 to 2018 shows no Pearson Correlation to temperature. However, there is strong correlation to decreases in temperature caused by volcanic activity and increases in temperature caused by El Niño events, link.
Greenhouse theory and models predict an accelerated warming with the increasing carbon dioxide. Instead, a negative correlation between USHCN (United States Historical Climatology Network) and CO2 was found in the last decade with a Pearson Coefficient of -0.14. The US annual temperatures over the last century have correlated far better with cycles in the oceans and sun than carbon dioxide Joseph D’Aleo
Detection of Anthropogenic CO2: A problem with the measurement of anthropogenic CO2 is that atmospheric carbon is also influenced by natural carbon cycles (source and sink rates), link. In fact, it is claimed that the emissions of anthropogenic CO2 are so tiny compared to the net atmospheric CO2 concentration that they cannot be measured or detected. In other words, anthropogenic CO2 is statistically insignificant with regard to the net atmospheric CO2 concentration – it cannot be differentiated from random noise in the measurement of the very much larger net atmospheric CO2 concentration. Therefore, human-produced CO2 has no measurable effect on our environment or on Earth’s temperature or on global warming or on global cooling, link.
CO2 is not the greenhouse effect. There is no method to actually measure such a small amount of energy (from anthropogenic CO2). Water Vapor is 90-95% of the “greenhouse effect” [Prof. D.J. Easterbrook, Prof Emeritus Geology, Western Washington University]
No signs of anthropogenic climate change have been discovered, link
CO2 and the Oceans: The oceans contain more than 1000 times the energy of the atmosphere; this means that earth’s atmosphere as a whole – regardless of which gases make up the atmosphere – cannot warm the oceans in any significant amount. Rather, the oceans warm the atmosphere. During the day, the ocean surface is warmed by solar radiation and that warmth results in release of large amounts of CO2 into the atmosphere (the amount released dwarfs anthropogenic CO2). Then, at night, the cooler ocean surface re-absorbs large amounts of CO2 since it is very soluble in cold water. This means that an atmosphere high in CO2 could not significantly change the earth’s average temperature since the ocean with its huge heat content would control the temperature of the atmosphere. In fact, as discussed below, exponentially less warming results from each incremental increase in CO2. Each doubling of CO2 concentration results in incrementally less warming, following a logarithmic progression, link.
CO2 and Saturation – Greenhouse Equilibrium: It might be assumed that increasing the CO2 level in the atmosphere has a linear heating effect. A linear relationship means that temperatures would rise by the same amount for every, say, 20 ppm rise in CO2 concentration. But in reality the CO2-temperature relationship is logarithmic, i.e. nonlinear, link. This means the atmosphere maintains a “saturated” greenhouse effect, controlled by water vapor content. There is a greenhouse equilibrium mechanism, whereby adding anthropogenic CO2 to the atmosphere simply rains out almost an equivalent amount of water vapor, Gregory, 2009.
Taking an example, [Archibald, 2010] the first 20 ppm rise in CO2 could give 1.7 deg C rise, the next 20 ppm rise only 0.35 deg C rise, and the next 20 ppm rise just 0.2 deg C rise, and so on. Put simply, as we add more CO2 to the atmosphere, the effect of extra CO2 decreases. There is a rapid saturation effect such that further 20 ppm increases produce only a tiny increase.
Given where Earth’s atmosphere sits today (at 390 ppm, 2010), it is apparent that further increases in CO2 will produce only very small increases in radiation forcing and thus global warming … a doubling of carbon dioxide over pre-industrial concentrations (280-560 ppm) will produce under 1 deg C of additional warming, link
Fig.11: GHE of CO2. Monte Hieb 2007, CO2 Controversy. Enlarge
The “Greenhouse Effect” (GHE)
The greenhouse effect occurs when heat-trapping gases in Earth’s atmosphere trap the Sun’s heat. Invariably, the IPCC, governments and media concentrate on just one of these gases (CO2) and fail to mention that there are other gases contributing to the overall GHE. It is claimed that about 4% of atmospheric CO2 is anthropogenic, the rest is natural, link. The UK contribution to this 4% is about 1%, link, or just 0.04% of total atmospheric CO2.
But it is not sufficient to merely quote the relative percentages of these gases since they are not equal in their heat-retention properties. Percentage concentrations must be changed to percentage contributions to GHE, link, link. Figure 11 shows that the GHE of all CO2 (both anthropogenic and natural) is only about 3.6% of the total greenhouse effect (2007 data), and is totally dwarfed by the GHE of water vapour (about 95%). Finally, noting that anthropogenic CO2 is only about 4% of the total atmospheric CO2, then the contribution of anthropogenic CO2 to GHE is only about 3.6 x 0.04 = 0.14% when water vapour is included. Even the total human contribution to the GHE (all anthropogenic greenhouse sources) is still only about 0.3% when water vapour is included, link.
The most important greenhouse gas is water vapour, which is responsible for about 96 to 99 percent of the greenhouse effect, Prof. Jaworowski, Warsaw
So, despite the IPCC claims, it appears that water vapour is the most significant greenhouse gas. This has already been discussed under “CO2 and Saturation”, where water vapour simply “rains out” a relatively small increase in CO2.
Terminology: A greenhouse is actually a poor analogy for earth’s climate. Greenhouses are closed systems except to incoming energy, whilst Earth is an open system, open to receive energy but also open to transmit energy back into space.
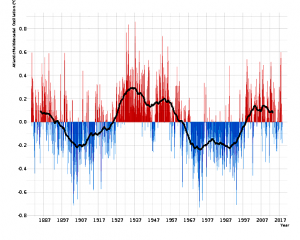
Fig.12: Atlantic Multidecadal Oscillation (AMO). Giorgiogp2, bender235 [CC BY-SA]. Enlarge
Natural Cycles: Atlantic and Pacific Oscillations
The US NOAA and the UK Met Office are fully aware of the role played by natural cyclical changes in the oceans. They modulate decade-scale cyclical climate changes through changes in atmospheric circulation. For example, the Atlantic Ocean’s surface temperature (equator to Greenland) naturally cycles between warm and cold phases every few decades and is referred to as the Atlantic Multidecadal Oscillation (AMO). The range is about 0.6°C between extremes, link. It follows a quasi 60 year cycle, 30 years warming followed by 30 years cooling. Figure 12 shows the AMO cycles (without the upwards trending North Atlantic sea surface temperatures, link).
A cold phase is linked to sea-level rise on the north-east coast of the US, and African droughts, whilst the warmer phase from the late 1990s is linked to warmer conditions in Western Europe and worse droughts in the US Midwest. Through changes in atmospheric circulation, the AMO also modulates spring snowfall over the Alps and glacier mass changes, link. The AMO is now due to enter it’s cooling phase and global temperatures may therefore continue to trend sideways or down, link, link, link.
Once the AMO cycle is subtracted from observations, the transient climate response (to CO2) is revised downwards consistent with latest observations, link
Between now and the AMO trough (c2040), the North Atlantic should begin to cool and the Arctic sea ice begin to recover, link
The theory remains that the Pacific Decadal Oscillation is the main mode of variability regulating temperature in the Pacific Ocean, contributing to the global warming hiatus, link
El Ninos: The Pacific Decadal Oscillation (PDO) – cycle period roughly 60 years – is often described as a long-lived El Nino-like pattern, link. Causes for the PDO are not currently known, giving uncertainty in climate modelling, link. During an El Niño, the warmer tropical waters in the Pacific can transfer their energy to the atmosphere and this can increase global average surface temperature. The El Nino’s of 1982-1983, 1997-1998 and 2015-2016 have been termed “super” El Ninos, link. For a time, the large 1997-1998 El Niño had a marked effect on global temperature increase.
Fig.13: Decreasing Solar Irradiance. Image: David H. Hathaway, NASA public domain. Enlarge
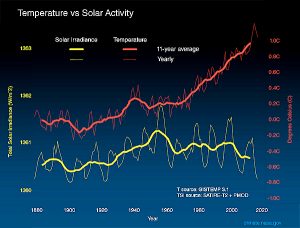
Fig.14: Total Solar Irradiance and Temperature. Credit: NASA-JPL/Caltech, NASA-climate. Enlarge
Natural Cycles: Solar Irradiance
A key question in the climate debate is: “Does global temperature change correlate with solar irradiance change?”
Solar irradiance is the solar power falling on the earth (in W/square meter). The sun’s irradiance fluctuates constantly in conjunction with the sunspot number (SSN), which varies over an approximate 11 year cycle, Fig.13. Sunspots are darker, cooler areas of the sun. But contrary to intuition, it has been shown that more sunspots deliver more energy (irradiance) to the atmosphere, and temperatures rise, link. This is clearly shown at SSN-irradiance. So the total solar irradiance (TSI) is larger during the portion of the 11 year cycle when there are more sunspots. Solar cycle 24 peaked around 2013 and cycle 25 is expected to peak around 2025, link.
The IPCC View on the Sun
Figure 14 shows global temperature plotted against solar irradiance (note the 11 year cycles). There is a (delayed) positive correlation only up to about 1980. Thereafter, solar irradiance appears to have little effect, and subsequent temperature increase is attributed to the increasing dominance of anthropogenic CO2, link.
It is extremely unlikely that the Sun has caused the observed global temperature warming trend over the past half-century [NASA]
Caveat: the TSI data source for Fig.14 changed from 1979 onwards, link. It is claimed that “for many years the IPCC advocated a wrong temperature distribution which exaggerates the rise of the temperature in recent years”, link, link.
That said, the NASA view has wide support:
Since the pattern of the recent observed warming agrees better with the greenhouse warming pattern than with the solar variability response, it is likely that one of these factors is the increase of the atmospheric greenhouse gas concentration, link
While solar changes have historically caused climate changes, the sun is mostly likely responsible for less than 15 percent of the global temperature increases we’ve seen over the last century, during which human-caused changes such as increased greenhouse gases caused the majority of warming, link
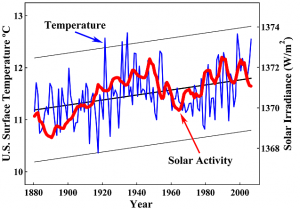
Fig.15: Correlation of SSN and Land Temperature. Credit: Robinson et al., 2007. Enlarge
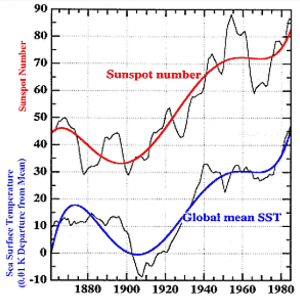
Fig.16: Correlation of SSN and mean SST. With permission from Prof. Giora Shaviv 2016. Enlarge
Correlation of Sunspot Number (SSN) and Temperature
Despite the NASA and IPCC rejection of significant solar influence in the latter part of the 20th century, analysis of the relationships between solar activity and temperature continues. In 2017 alone there were 80 scientific papers linking “solar forcing” to climate, link, link. For example, Harde 2017 concludes:
The IPCC denies any noticeable solar influence on the actual climate, although strong evidence of an increasing solar activity over the last century exists … the measured temperature increase of 0.74°C over 1880–2000 and the observed cloud changes of −4% over the period 1983–2000 can best be explained by a cloud feedback mechanism, which is dominated by the solar influence … resulting modelling gave a CO2 initiated warming of 0.3°C [1880-2000] and a solar contribution of 0.44°C [1880-2000]
Correlation coefficients have been computed between annual mean SSN and monthly sea surface temperature (SST). SSN and SST have been found to be positively correlated in wide areas of the world over at least eight cycles of solar variations, link:
The record of globally averaged SST over the past 130 years shows a highly significant correlation with the envelope of the 11‐year cycle of solar activity over the same period, link
Using 150 years of SST data (1854-2007) we found a robust signal of warming over solar max and cooling over solar min, with high statistical significance (see Fig.1 of paper), link
Analysis of solar activity and SST from 1901 to 2011 indicated that sunspot numbers and SST were positively correlated in wide areas, link
The solar magnetic cycle length also correlates well with temperature; “Long-term variations in Earth’s temperature are closely associated with variations in solar cycle length”, link, link.
Do direct measurements support these statistical studies? Consider the US surface temperature measurements in Fig.15. Here, TSI is measured by sunspot cycle amplitude, sunspot cycle length, solar equatorial rotation rate, fraction of penumbral spots, and decay rate of the 11-year sunspot cycle, link. It is clear that temperature correlates well with solar irradiance change even after world hydrocarbon use started rising sharply around 1950. Similarly, there is strong correlation of SSN with mean global sea surface temperature (SST) up to at least 1980, Fig.16.
The Importance of Clouds
There are several proposed models for how the sun influences global climate, see solar forcing. As mentioned, clouds are a crucial player in Earth’s climate. They are the Earth’s sunshade, and if cloud cover changes for any reason, you have global warming — or global cooling.
Possible Model: during solar minima, the sun’s magnetic field weakens and the outward pressure of the solar wind decreases. This allows more cosmic rays from deep space to penetrate Earth’s atmosphere. The Cosmic Rays create aerosols which then seed clouds, link.
Conversely, an active sun causes the earth’s magnetic shield to diffuse more cosmic rays from reaching into our atmosphere. Since these rays have a low water cloud formation enhancing effect, an active sun (as in the latter part of the 20th century) usually means less low clouds and thus warmer temperatures, link. This is confirmed by studies for the late 20th century warming period, which show decreases in low-level cloud, link. This is also shown in Figs.15-17.
Most of the global warming of the twentieth century can be quantitatively explained by the combined direct (irradiance) and indirect (cosmic ray induced low cloud) effects of solar activity. Similarly, we find the lower level of solar activity in the Maunder Minimum predicts an increase in the low cloud factor that gives rise to an increased albedo for the Earth and lower global temperatures, Bago and Butler, 2000
Fig.17: Sunspot Activity (red line is 11 year mean), showing Dalton Minimum. Courtesy SIDC, Solar Influences Data Analysis Center. Enlarge
Global Cooling? It is known that high thin cloud tends to increase earth surface temperature, whilst low thick cloud reflects solar radiation and cools the earth. But averaging the effect around the globe shows that cooling predominates, link. So the net effect of reduced solar activity is increased cloud cover and a cooling of the Earth surface. Between 1790 and 1820, a minor decline in solar activity called the Dalton Minimum correlated with lower global temperatures. This sunspot low is shown in Fig.17. Will the declining sunspot activity in cycles 24 and 25 (Fig.13, Fig.17) lead to global cooling? Research indicates that any decrease in temperatures will not be worldwide, but localized to specific areas, link. Conversely, during the last few decades of the 20th century, solar activity increased, cloud cover decreased (by about 0.4% per decade), and the mean global surface temperature rose.
Figure 1 of Zhou and Tung, 2010 lends support to the cloud theory. Between 1870 and 1910 the TSI decreases (increased cloud cover) and SST falls, whilst from 1910 to 2010 the TSI rises or stabilizes (less cloud cover) and SST rises.
The models drastically simplify large and small-scale ocean dynamics and aerosol changes that generate clouds (cloud cover is one of the key factors determining whether we have global warming or global cooling), link
Quotes Supporting Solar Influence on Climate Change
CO2 is not responsible for heating the earth, the cause is the activity of the sun. The movement of the sun affects temperature, which influences the levels of CO2, and these levels have risen and fallen for centuries. [Professor Emeritus Giora Shaviv, professor of physics and the Swartzmann-Medvedi chair in Space Sciences at The Technion in Haifa]
The solar irradiance AND solar wind determine the temperatures in earth. As I have shown, the solar wind is decisive. It manipulates the geomagnetic field and cloud covering. Temperatures oscillate according to the sun. By adding the AMO index oscillation (that counts for internal system variability) to the two solar constituents, we get an extremely accurate temperature projection, Dimitris Poulos, National Technical University of Athens
Periods with few sunspots are associated with low solar activity and cold climate periods. Periods with many sunspots are associated with high solar activity and warm climate periods, Yndestad and Solheim 2017
The main warming from an energy budget standpoint comes from increases in absorbed solar radiation that stem directly from the decreasing cloud amounts. These findings underscore the need to ascertain the credibility of the model changes, especially insofar as changes in clouds are concerned, link
A positive and significant correlation between our SST record from the North Icelandic Shelf and reconstructed solar irradiance, together with modeling results, supports the hypothesis that solar forcing is an important constituent of natural climate variability in the northern North Atlantic region, link
The Biblical View of Climate Change: It’s God’s Weather!
Given the scientific uncertainty as to the cause of climate change, there is a third view to consider:
Climate change is part of God’s end-time scenario – it is God who is controlling the climate
In fact, according to the Bible, it may be more logical to watch for severe ‘weather events’ rather than long-term ‘climate change’. Biblical weather events seem short-term (hours-days-years) as apposed to climate change which is measured over multiple decades. Since the Bible claims to be the source of absolute truth (as opposed to science which only claims to hold tentative truth), we can say with certainty that what we observe comes under God’s control – it’s actually God’s weather:
God’s Weather Control in the Past
The God of Israel has used the weather to influence nations and individuals in the past:
- Flooding rain: Noah’s universal flood (Gen 6:4)
- Extreme hail – the seventh plague of Egypt (Exod 9:18,23-25)
- Drought: on disobedient nations e.g. on Israel (Deut 28:23,24, 2 Chron 7:13)
- Rain control: through man’s prayer (James 5:17-18)
- Severe hail: the seventh plague on Egypt (Exod 9:18,25)
- Thick darkness: judgements on Egypt (Exod 10:21,22, Ezek 30:3, Ezek 32:8)
- Severe hail: Israel’s protection when attacked (Joshua 10:11)
- Severe storm and wind: judgement on Israel’s false prophets (Ezek 13:13)
- Storm calming: protection of the disciples (Mk 4:39)
God’s Weather Control in the Future
Bible prophecy says that God will use severe weather events to ‘speak’ to the nations at the end of this age. Prophetic signs and the state of the world suggest the end of this age is imminent:
- Withering drought: because nations ignore God’s laws (Isa 24:4,5)
- Scorching heat: because rebellious nations ignore God’s laws (Isa 24:6)
- Torrential rains: coupled with geological changes just before Christ returns (Isa 24:18)
- Raging seas: (coupled with cosmic signs) herald the return of Christ (Lk 21:25)(Jer 31:35)
- Severe localised storms: judgments on nations who attack Israel (the Gog-Magog war) (Ezek 38:22)
- Heavy snow, destructive hail: on nations during the Antichrist’s reign (Job 38:22,23)
- Extreme heat and fire: the power of the sun is increased in the fourth bowl judgment (Rev 16:8,9)
- Extreme hail: the seventh bowl judgement (Rev 16:21)
- Early and latter rains: blessings upon Israel’s crops during Christ’s Millennial reign (Joel 2:21-27)
Curiously, most of these biblical events (flood, drought, heat, storm) appear similar to the scenario predicted by the IPCC. However, the causes are distinctly different. As mentioned, the IPCC CO2 warming theory spans multiple decades and is now referred to as climate change, whereas when God intervenes it appears to be a “weather event” rather than “climate change”. Biblical intervention is often very short term, spanning just days to a few years, and so is not compatible with the IPCC theory. We might also ask, can rebellious mankind really control the climate/weather when he arrogantly rejects the Bible?
Earth Orbit Change? According to Bible prophecy there will be God-induced astronomical changes at the end of this age. Specifically, “the earth will move out of her place” (Isaiah 13:13). This implies either orbit change and/or axial tilt change (in addition to the normal axis “wobble”), link. Since earth tilt gives us our seasons, these changes probably induce severe weather events.
Summarizing, if we are indeed close to the end of this age, then according to Bible prophecy dramatic weather events seem imminent, if not already present. It seems the God of the Bible will soon use severe weather events to speak to, and judge, rebellious nations.
For when the earth experiences Your judgements the inhabitants of the world learn righteousness (Isa 26.9)
Given Bible prophecy and the observed climate/weather scenario, it is clear that the Second Coming of Christ is imminent. What will Christ say to you?
The good news is that the Millennial Age follows these these tragic end-time events. It will be a time of God’s blessing on the earth. There could even be true “climate change” – but this time for the better. Today all of creation “groans” (as in weather problems) but a time is coming when creation will be delivered from this bondage (Rom 8:21,22). With the occasional exception (Zech 14:17) the world will be at peace (no wars), Israel will become like the Garden of Eden, crops will be abundant and Gentile nations will go up to Jerusalem to worship the LORD (Ezek 36:29,30,35, Amos 9:13, Zech 14:16).
Summary and Conclusions
The purpose of this review is to highlight the range of scientific thinking on climate change. Certainly the world’s climate has changed since the end of the 19th century:
- The world has warmed by 0.8 degrees C
- Most glaciers retreated
- Average sea level rose about 9 inches (about 2mm/year)
- Water tables fell significantly (China: 1.5m/year, India: 1-3m/year)
- Some claim there are more severe weather events (although this is rebutted, link)
Anthropogenic Climate Change
So, given media and government emphasis, it is hardly surprising that public concern over climate change has increased. About 80% of the UK public are now “very” or “fairly” concerned, and 72% of Americans now feel global warming is personally important, link, link. The Government “solution” is to curb man’s CO2 emissions.
But the supposed causal relationship between earth’s atmospheric CO2 concentration and global temperature is rarely questioned on the media. As discussed, many scientists maintain these changes are primarily due to a combination of natural causes, not CO2 change. Consider some CO2 statistics:
- About 96% of atmospheric CO2 is from natural causes and only about 4% is anthropogenic
- The UK contributes just 1% of this 4%, or just 0.04% of the total atmospheric CO2
- Total atmospheric CO2 (natural and anthropogenic) causes only some 3.6% of the Greenhouse Effect (GHE). Water vapour is responsible for 95%
- Of the 3.6%, only about 0.12% of the GHE is due to anthropogenic CO2 when water vapour is included
- All human activity (all anthropogenic greenhouse sources) contributes only about 0.3% to the Greenhouse Effect (GHE)
According to these statistics, the warming effect of anthropogenic CO2 is extremely small when compared to that of water vapour. So will curbing anthropogenic CO2 have any effect on climate change? Given the statistics, is a ‘zero carbon’ target meaningful? Many researchers claim that anthropogenic CO2 is not driving warming. Consider some points against the CO2-warming theory:
- Sea level rise and glacier retreat began at least 100 years before serious fossil fuel use, and the rate of rise and retreat didn’t change when serious fossil fuel burning started around 1950
- Anthropogenic CO2 concentrations are difficult to measure (atmospheric carbon is also influenced by natural carbon cycles)
- CO2 increase lags temperature increase – sometimes by hundreds of years. This suggests CO2 is not the causal factor
- Despite IPCC graphs, others find atmospheric CO2 changes and temperature changes to be poorly correlated (even negatively correlated)
- IPCC greenhouse warming models assume invalid presumptions and non-realistic carbon cycle modelling
- CO2 atmosphere theory is invalid since it is ocean temperatures that control atmospheric CO2 levels. The oceans contain more than 1000 times the energy of the atmosphere. This means CO2 cannot warm the oceans by any significant amount
- The CO2-temperature relationship is claimed to be logarithmic, not linear. There is a rapid saturation effect i.e. successive increases in CO2 concentration – each by the same amount – produce progressively smaller increases in temperature
Natural Climate Change
Of the principal views on climate change, natural and cyclic change is well supported by many researchers, but is ignored by the media and politicians. Long-term and short-term periodic climate changes have occurred over tens of thousands of years, link. Periodicity is seen in inter-glacial warm periods (Fig.10), the 60-year Atlantic and Pacific multidecadal temperature oscillations (Fig.12), and 11-year solar irradiance cycles (Fig.13). The AMO is currently in a warm phase, warming Western Europe.
The underlying climate change we observe today may simply be due to the natural temperature rise (about 5 degree C) from the last ice age, link. Over the past 150 years Europe and America have been emerging from the “Little Ice Age” (c1300-1850), a factor which has contributed to the observed 20th century warming, link.
So many scientists reject the CO2 greenhouse theory and claim the observed climate changes arise largely naturally, and especially from solar irradiance (sunspot) variation. In 2017 alone there were 80 scientific papers linking “solar forcing” to climate, link. For instance:
- Sunspot number and sea surface temperature are positively correlated (Fig.15). Research finds a robust signal of warming over solar max and cooling over solar min, with high statistical significance
- Sun activity (total solar irradiance) and land temperature are also highly correlated (Fig.14)
- The solar magnetic cycle length also correlates well with temperature
- Cloud cover is one of the key factors determining whether we have global warming or global cooling
- There is significant correlation between cloud cover (which affects temperature) and cosmic rays
- An active sun (as in the last half of the the 20th century, Figs.15-17) causes the earth’s magnetic shield to diffuse more cosmic rays from reaching into our atmosphere. Since cosmic rays lead to cloud seeding, this means less low clouds and thus warmer temperatures
- During both the Maunder Minimum (1645-1715) and the Dalton Minimum (1790-1820, Fig.17) there was a significant decline in solar activity (sunspots). Both events resulted in lower global temperatures
- Most of the global warming of the twentieth century can be quantitatively explained by the combined direct (irradiance) and indirect (cosmic ray induced low cloud) effects of solar activity
Summarizing, any climate change observed during the last few decades of the 20th century could be attributed in the main to increased solar activity and the resulting reduced cloud cover. It could also be due in part to the start of a warm phase of the Atlantic Multidecadal Oscillation (Fig.12). Short-term warming occurred from a succession of major El Nino events (1972–73, 1982–83, 1997–98, and 2014–16), link. Some claim that the official overall warming (Fig.1) may be attributed, in part, to manipulation of raw data, link, link.
God’s Intervention
The storms, droughts and temperature fluctuations the world has experienced over thousands of years are natural outcomes of a “fallen world” (Genesis 3, Romans 8:18-22).
In addition, Bible history and Bible prophecy point clearly to God’s timely and dramatic interventions which can override natural processes. These are usually dramatic, short-term (days to a few years) weather events ordained to arrest the attention of individuals and nations. To this end, prophecy says that dramatic weather events will intensify during the last few years of this age (just before the return of Christ), as part of God’s judgement upon a rebellious, godless world. In contrast, prophecy also says that God will bless Israel’s crops with correctly timed rains during Christ’s Millennial reign on earth.


.png)
Although there are problems in parts of the world where there have been problems intermittently since the world began most scientific studies into so-called global warming are flawed due to the fact that people are getting paid astronomic sums to support the pseudo-scientific aims of the very political Un-United Nations! A late friend of mine employed by the UN had to take legal action to prevent his name from being used in this connection, and he confided that 60% or more of the scientists agreed that it was a natural phenomenon, but because they relied upon the huge funding they were receiving were frightened, to tell the truth! One of the founding fathers of the Greenpeace movement, a real scientist, has written extensively and spoken often about the myth, which is costing the man and woman in the street millions of dollars, pounds, euros, et cetera whilst at the international politicians live and dine in luxury and again the ridiculous situation of a teenager with learning difficulties being allowed to, earn vast sums and flaunt herself in front of the media when what she knows is next to nothing!
Thanks for an honest comment. See also NET-ZERO CARBON at
https://seekingtruth.co.uk/extreme-weather/